


Sales Price vs. List Price
When it comes to making a competitive offer on a home, several things can come into consideration. All markets are different. This is why I always recommend getting a local Realtor. Find someone to rely on, then use their expertise to guide you when it's time to take the leap!
Is it a Buyer's Market or a Seller's Market. How many months of supply is there in the market today? How has this changed over the past 12 months? 6 months? There can be a lot of market data to sift through and that can be overwhelming. But, there's one particular stat that your agent should know, and all buyers should know before making an offer. Heck, they should know it before they even start looking at houses! That stat is Sale Price vs List Price, otherwise known as Asking Price.
Say you find an incredible house that hits the market and it checks all the boxes of what you're looking for. While there are many things that can make or break an offer, for this particular topic, we'll focus on price. Do you offer the seller what they're asking for? That's the List Price. Or do you offer them less? More? Maybe you want to offer that seller $10,000 less than their asking price to see if they'll go for it and you can catch a break. Maybe you can land a deal!
Not so fast. If this is the strategy being employed, it's probably the best way to have your offer declined. More likely, in Lawrence today, you'll be losing to another buyer who made a better offer to the seller. This is the reality of a Seller's Market, and with less than 2 months of overall supply, Lawrence finds itself in a very strong Seller's Market today.
Consider this graphic:
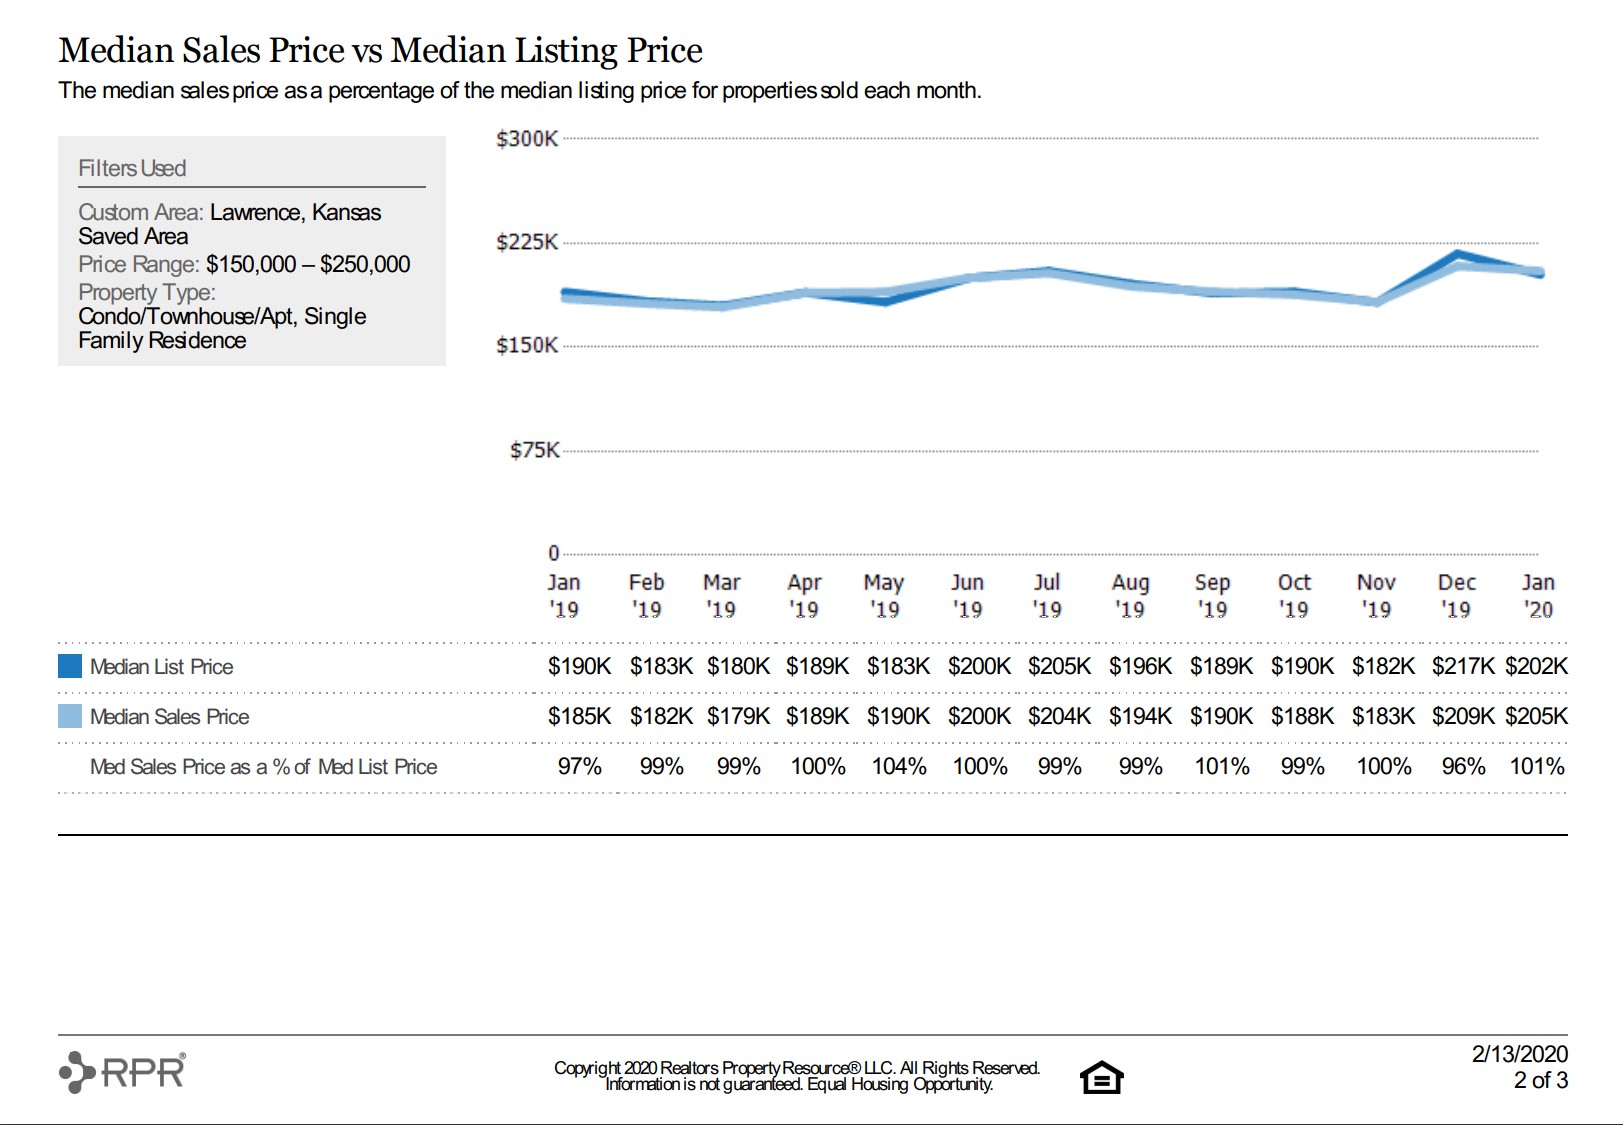
Here we can see 13 months of market activity in the $150,000 to $250,000. Most people would consider this price range to be the hottest in town, with the most listings and the most buyers. While these numbers do extend beyond this range, I believe it's important to break things down by price ranges, or by certain locations. For example, the market is pretty hot under $300,000, but get much above that and it's a different story. Knowing how the data differs between price ranges can, and should, inform your strategy.
Going back to the graph above, as you can see, the median Sales Price vs. List Price is 101%, and over the 13 months it's averaged at about 100%. If you knew that kind of information before making an offer on a home, would it change the way you approach it? It should!
The graph shows that more than HALF the homes in this price range sold for MORE than their asking price last year. I'm willing to bet that most of those who sold for less were homes that were priced incorrectly to start. They probably sat on the market for more than the average time before the seller finally accepted a lower offer. So even if you see that new listing that appears to be overpriced, keep in mind that that particular seller hasn't learned that lesson yet. They're not going to take a low offer in the first week of hitting the market.
Still thinking of making that low offer? If you're in the upper market price ranges, you might be able to find some wiggle room. But for the majority of buyers in Lawrence today, this is the kind of information they need to weigh when coming up with a competitive price. My advice to buyers can vary depending on the property, whether there are other offers on the table, and how high a particular buyer is able and willing to go. The rest can come down to the other elements of a contract that can make an offer even more competitive. But that's a topic for another day. Either way, this should illustrate the importance of having a local Realtor who knows and uses the market data!
At R+K, we differentiate ourselves by our ability to offer unique solutions for our clients. We live and work here in Lawrence and we know the market climate. If you're interested in learning more about what we offer, just get in touch. We love to talk about what we do!


