Just when you think things are looking one way, the stats come out and surprise you! Such is the story of the Lawrence real estate market in October. September's numbers were way down across the board. I was also firmly under the impression that October would hardly see any improvement. If anything, I anticipated numbers being even further down! However, that appears to not be the case. Closed transactions increased in October to the tune of 20% from September. Average price is up again and time-on-market is back down. While it's certainly true that the market has shifted since Spring and Summer, it's still a very tight market and one that's still very much favoring sellers. I decided to take a deep dive into the numbers to see what's going on.
All of the stats that follow are sourced from the Lawrence MLS. What follows is a look at some numbers through the month of October within the city limits of Lawrence:
Month-over-Month
- October home sales were up 20% over September
- Average price rose 6.75% t0 $332K in October vs. the previous month; Median sales price rose 7.5%, up to $312K
- Median Days-on-Market dropped from 11 in homes closed in September to 5 for homes closed in the month of October
- 70 homes were listed in October, a decrease from 92 listed in October a year ago
- List-Price-to-Sales-Price Ratio for October was 98.5%
Year-over-Year
- Home sales are down 8.3% in 2022 vs through October of 2021 for a total of 1,025 sales this year
- Average Price through October for the year is up 12% to $329K; Median is up YoY 13% to $295K
- Dollar Volume is up 2.5% for the year, despite fewer home sales
- List-Price-to-Sales-Price Ratio is 100.97% for the year
- 1,200 homes have been listed for sale through October, a decrease from 1,345 listed through October of 2021
Active Properties
- There are 81 "Active" properties in Lawrence as of this writing, a decrease of 7 since my last update
- There are 81 properties currently listed as "Under Contract"
So, what the heck? One thing I can say for certain is that the market sure is throwing people for a bit of a loop these days! I have a hunch that October sales account for a number of contracts written in August, as opposed to September. September contracts were down so I'm anticipating that when we look at the November numbers next month, we'll see a major decline in sales. How this anticipated decline effects average price and dollar volume will be interesting questions needing answers. Despite being surprised for the October numbers, I do not believe I'll be surprised again one month from now.
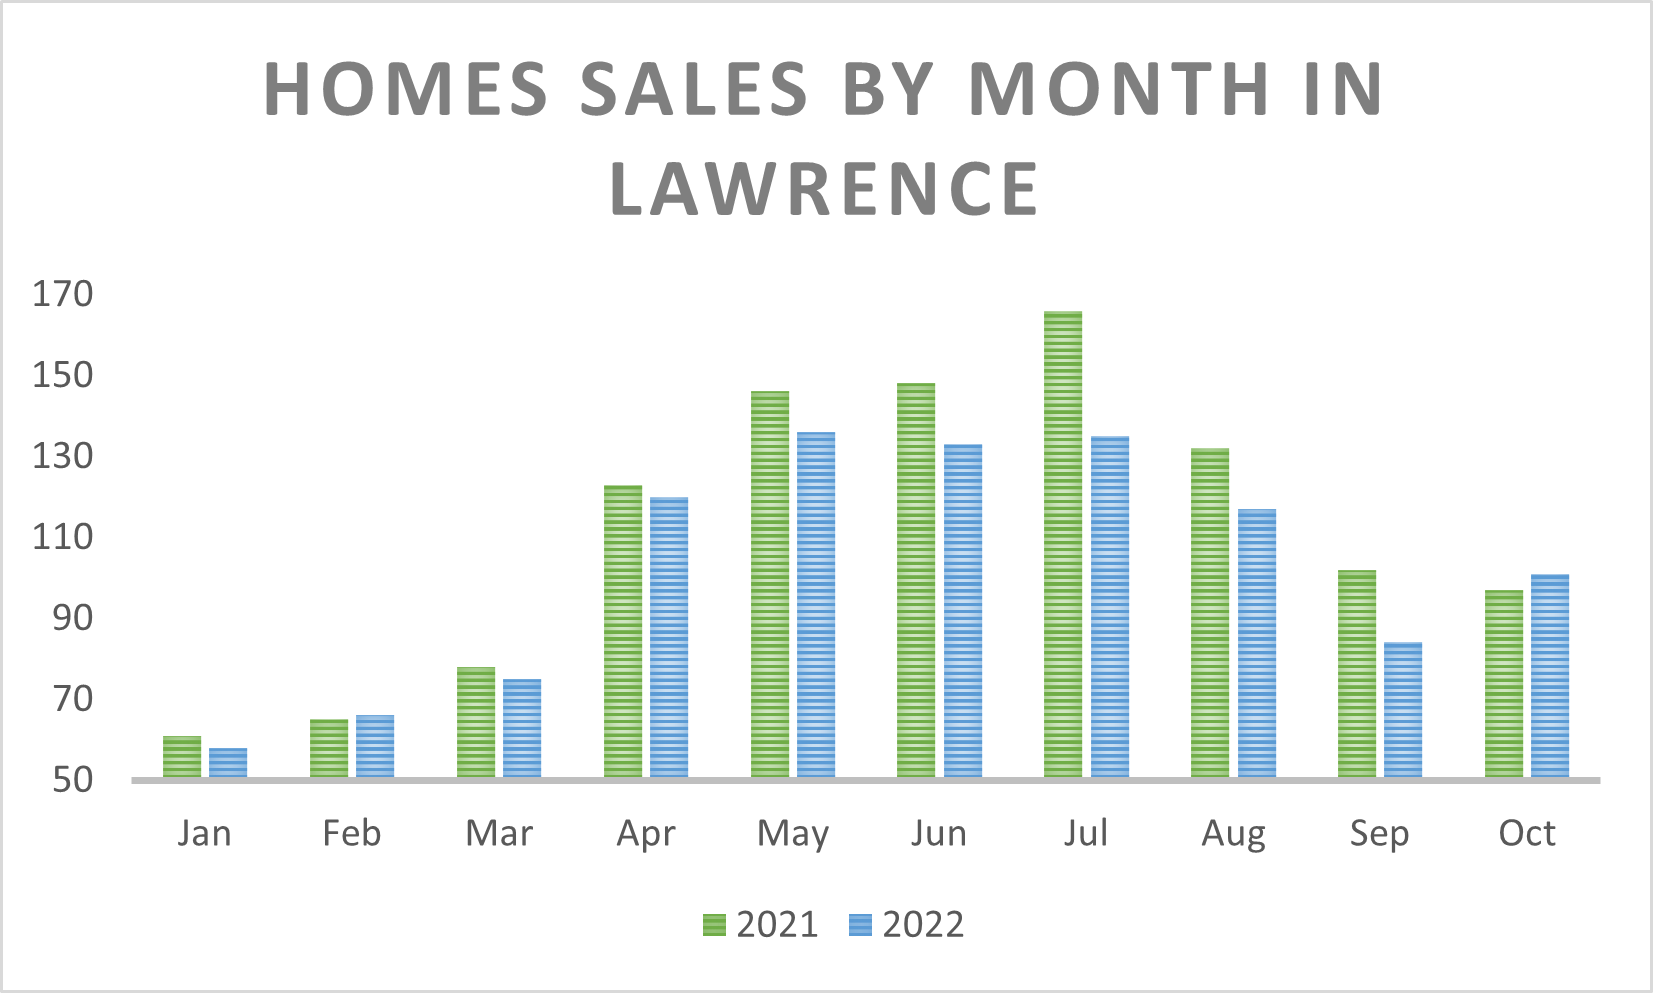
Since the year is almost over, I think it's a great time to look back at the last two years. There's no doubt we'll finish 2022 down in home sales but up considerably in average price. Here's a graph that illustrates home sales inside the city of Lawrence per month:
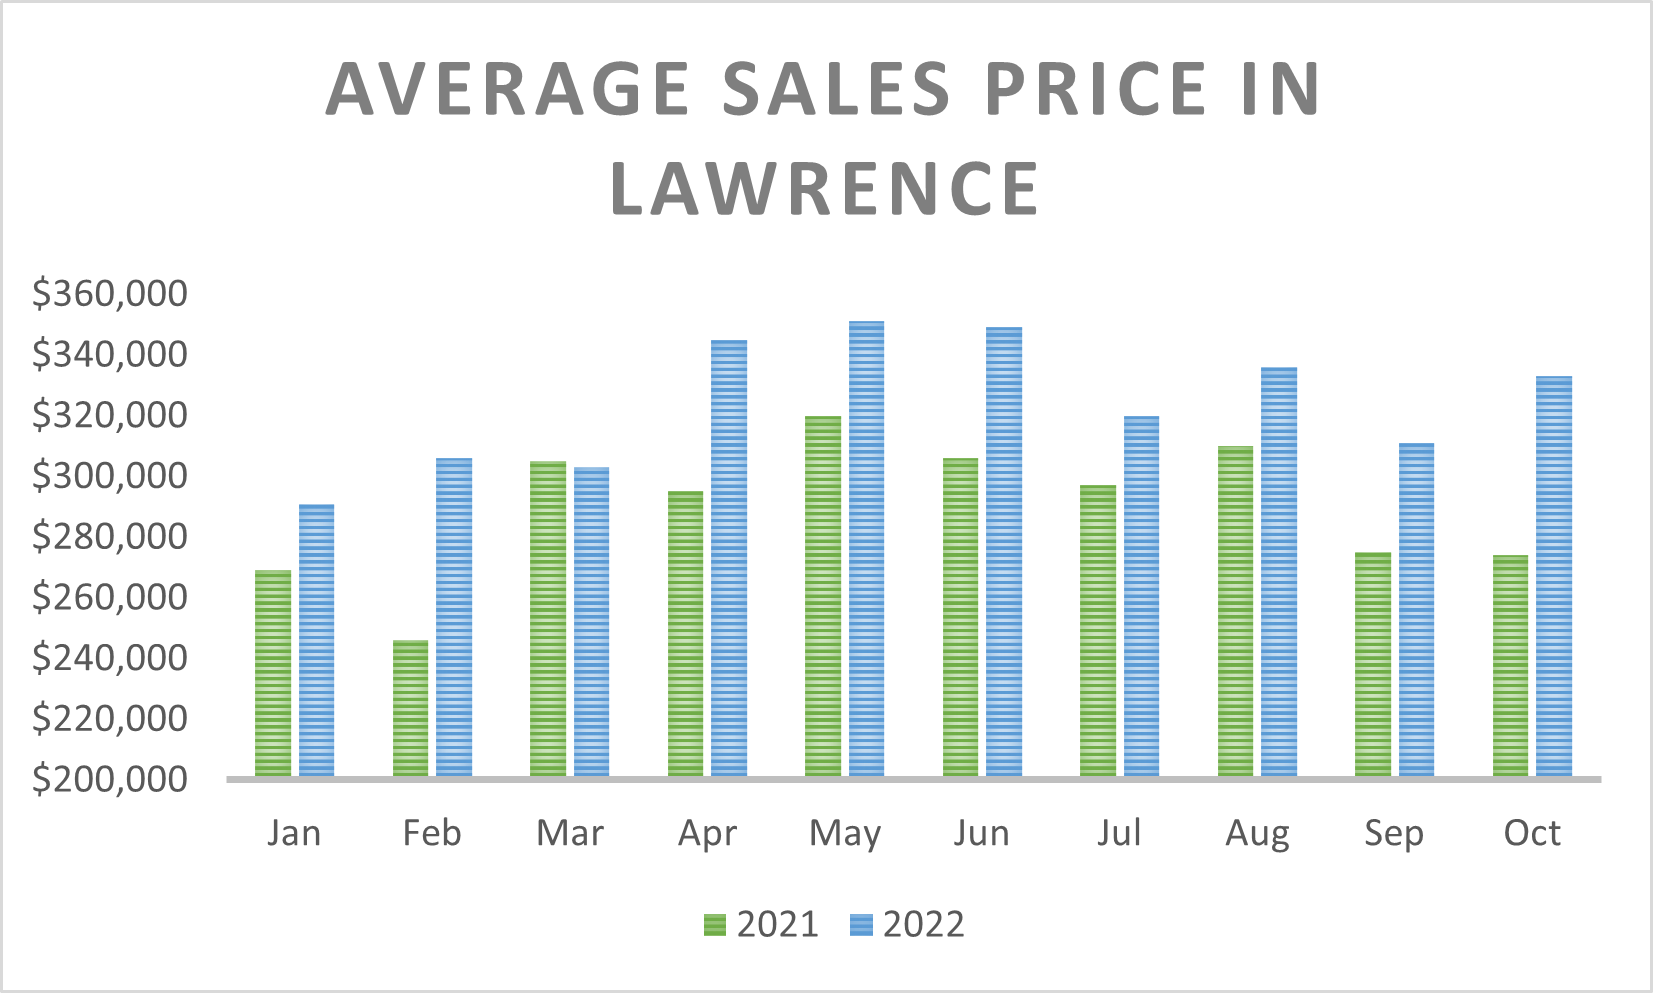
 As you can see, 2021 outpaced the current year every month in sales except for two months: February and October. Throughout most of 2022, each month has seen pretty dramatic declines in homes sold. This was particularly surprising when you look at the figures for September to October. October 2022 bucked a few trends with such a substantial increase in homes sold. October also reversed a gradual decline in sales month-by-month as the year recedes into the traditionally quieter months of Fall. Now here's a graph looking at average price:
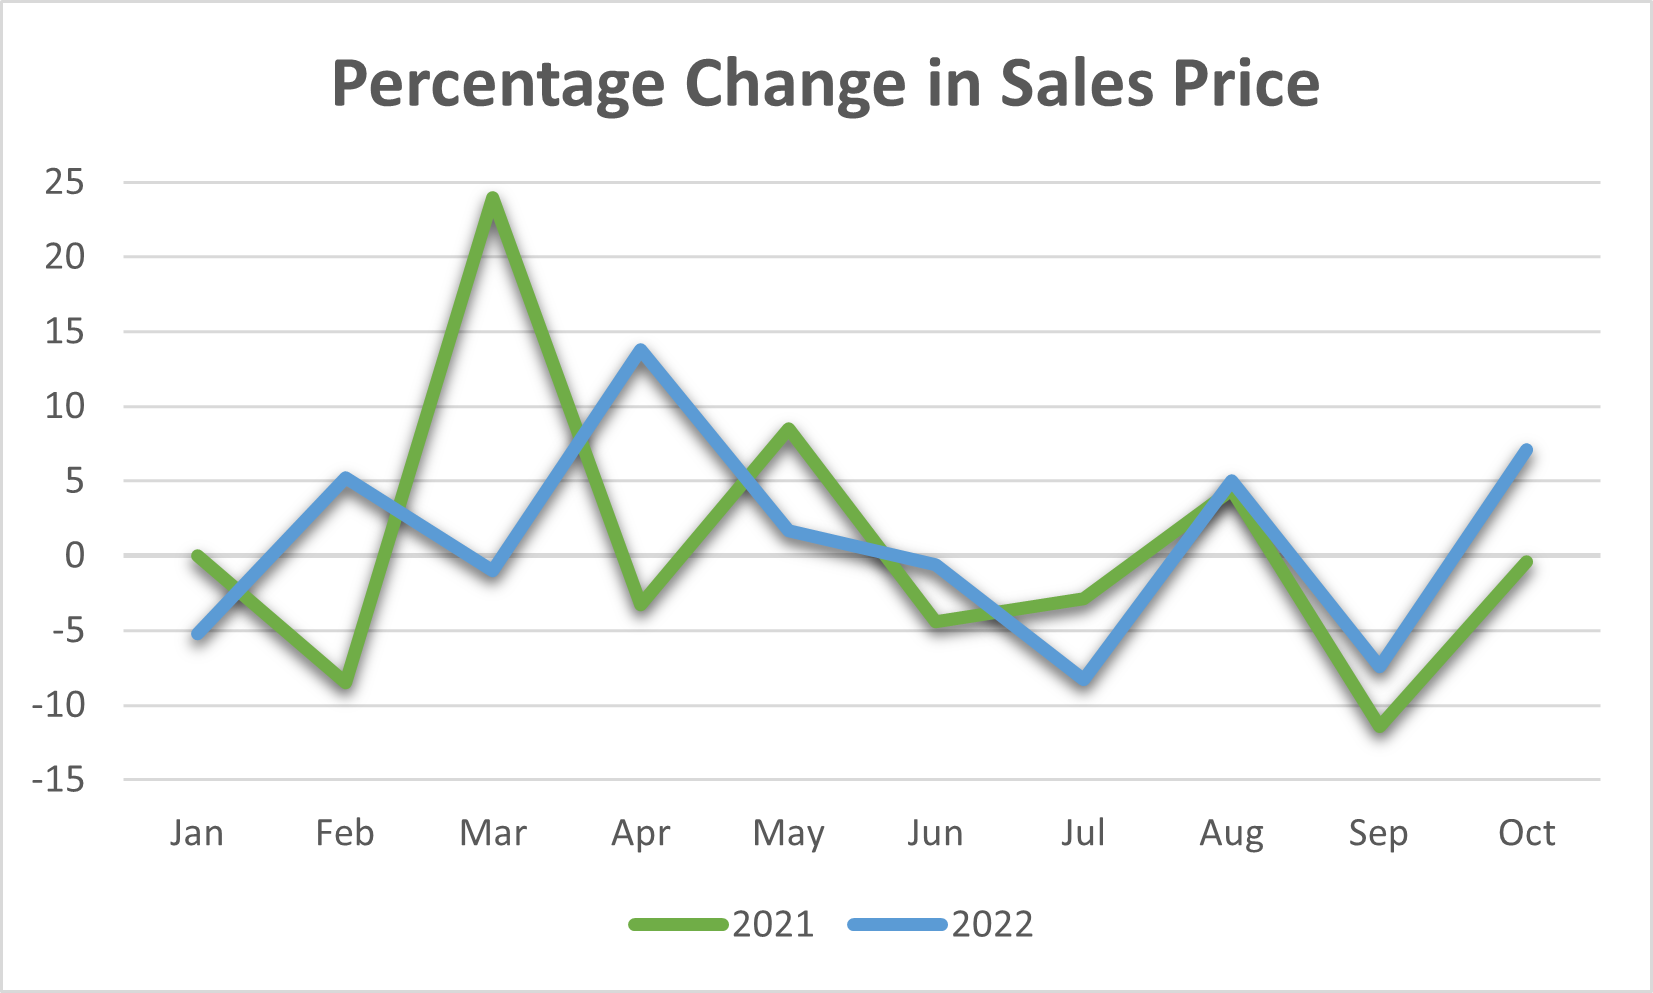
 In almost a complete reversal of the previous graph, here we can see that almost every month of 2022 has seen drastic price increases from the prior year. October 2022 certainly seems to stand out yet again. While expecting a reduction in the average price increase, it shot up to numbers more typically seen in the Spring Market! Continuing on, here's a graph illustrating the percentage change in price over time:
 Here we can see that March of 2021 saw a HUGE price increase from the same month the prior year (March 2020). What's interesting is that most of these figures are on the positive side of the graph. However July and September saw actual decreases in both 2021 and 2022. October of 2022 surprises again with a percentage increase not seen since earlier this year. September is usually a fairly quiet month. Everyone goes on vacation in August, school is starting and no one wants to move until that's over. The Fall Spike usually occurs in September and is reflected in closed transactions in October. While I did not feel we were actually seeing a Fall Spike, it apparently occurred nonetheless!
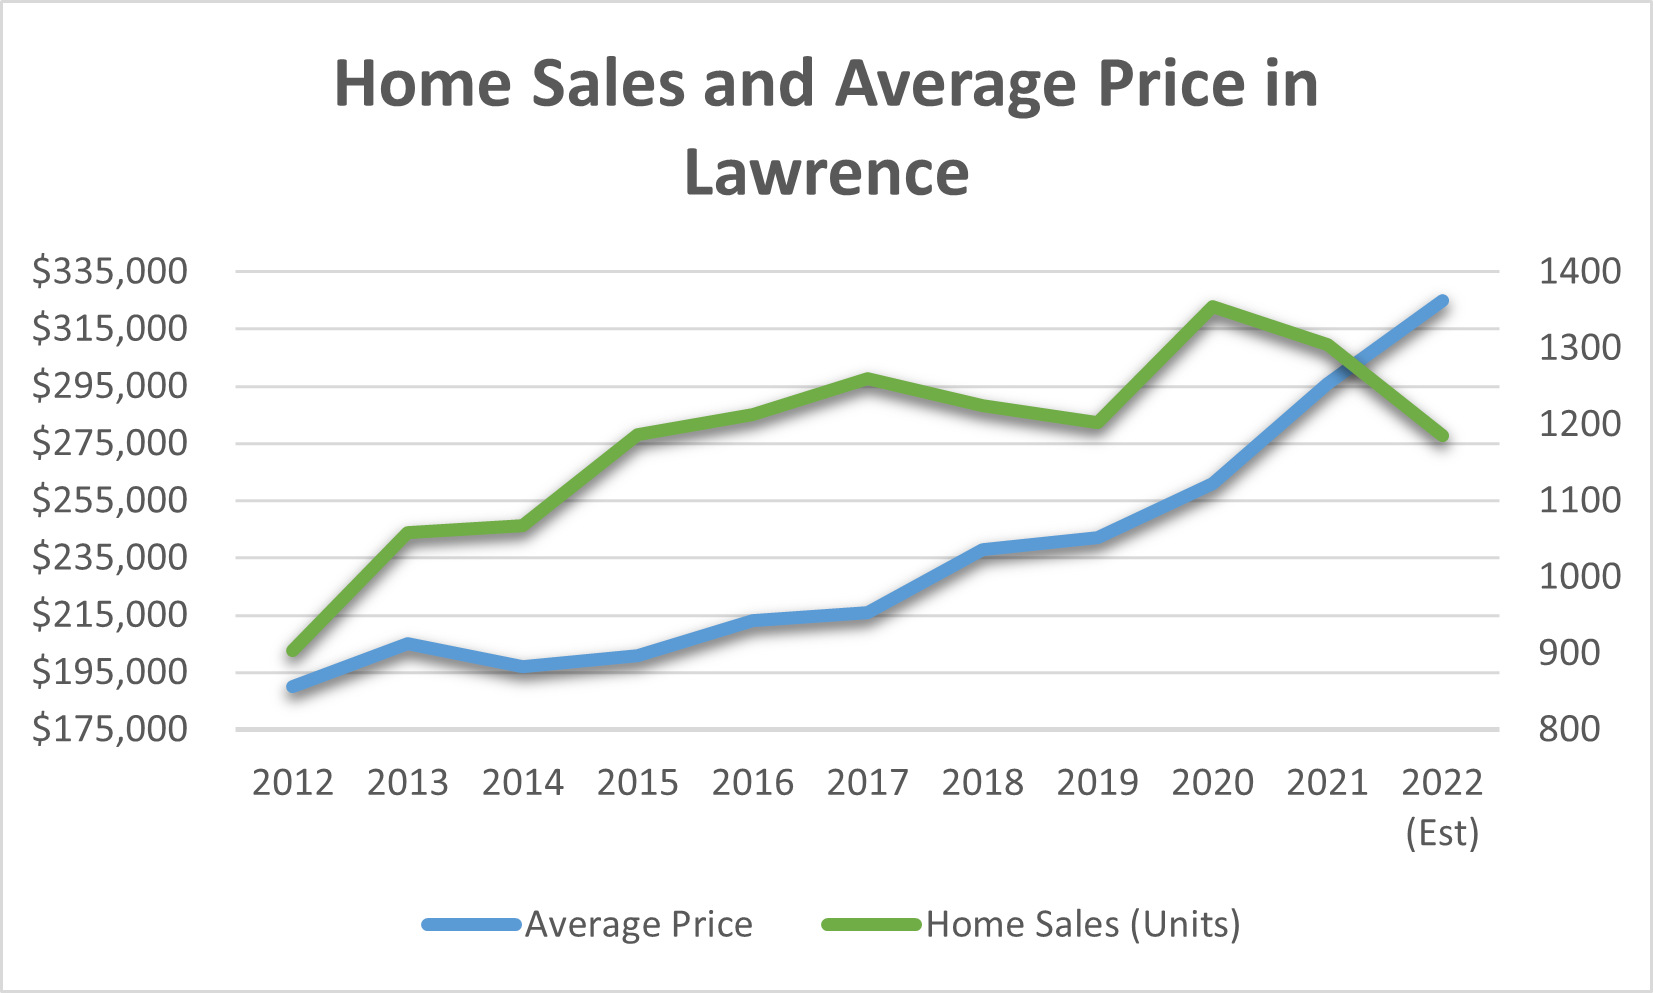
And because I think historical data always carries great value, I went ahead and looked all the way back to 2012 to compare the current year with past home sales and to see how average price has increased through the years. Take a look:
 It's pretty clear: home sales are falling and prices are increasing quicker. There was a slight dip in 2019 in home sales compared to 2018, but otherwise there's been a pretty steady increase in home sales year-to-year. 2020 seems to be the high water mark. We're now in the second year of a pretty reliable decline. Months-of-inventory currently sits around 1 month, give or take a tenth of a point. That means we're still very much in a Seller's Market. If rates stay above 6%, expect even fewer sellers to decide it's the right time to sell, despite rising prices.
Speaking of prices, that's perhaps the most striking element of the above graph. From 2012 to 2022, prices have increased a staggering 72%! Most industry people I speak with expect this trend to continue. Sorry for those of you who are thinking (hoping?) for prices to come down. Barring anything unforeseen, that's very unlikely to happen in 2023. However, instead of 12-15% increases, we'll probably only see 4-6% next year. That's good news for most people, especially buyers. But with rising interest rates, that's going to make life harder for those who are still in the market today. Many buyers have been taken out by the rising prices and interest rates.
Long story short, there's undoubtedly a market shift occurring as we speak. But it's in no way a crash. October's numbers refute that notion quite soundly. What we may be seeing is what many have termed a "return to normal," i.e. a market that begins to favor sellers and buyers more equally than it has in a while. After the craziness of the past 2 or 3 years, that may not be a bad thing! It's still a great time to buy, as home prices will likely continue to increase due to supply-side constraints. And many lenders are currently offering to waive refinancing fees next year if and when rates do come down. If you're looking to buy and have been sitting on the fence, that may be enough to spur you into action!
Stay tuned to R+K Real Estate for great new content, updates, advice, opinions and more in 2022. We plan to continue our advance of transparency, consumer advocacy, and empowering our clients with alternate business models designed to provide high levels or real estate service with drastically reduced commissions!
-Ryan Desch, Broker/Owner R+K Real Estate Solutions


