How is real estate like the game of baseball? It's all about stats! The Lawrence MLS is a huge database of real estate statistics. Since the early 2000's when the MLS when digital, all sales and basic home information for every listing entered has been saved. So, in the spirit of my monthly market updates, I thought it would be fun and interesting to look back through time at how the market has evolved. It's especially relevant and interesting in terms of current events, and how drastically the market has changed over just the past few years. Affordability and availability are hot topics at both the local and national levels. What follows is a dive into the stats by yours truly!
I'll point out from the start that there are limits to my analysis. First, my stats are taken entirely from the Lawrence MLS. While there are other ways to look at the stats, and some of those ways might be more comprehensive, I'm limited on time and resources to dive as deeply as say, a Wichita State economist might. Things that are going to be missed by my analysis include for-sale-by-owners, off-MLS sales, and sales on other MLS's (Kansas City/Topeka) that weren't added to the Lawrence MLS. However, the percentages of those outliers tends to remain steady through time, and a vast majority of the data is accounted for here. So while the total figures might not be all-encompassing, they're close enough for our purposes and any percentages should also hold pretty accurate. There's always gotta be some sort of disclaimer when it comes to numbers!
So why did I decide to take a historical deep dive into the Lawrence real estate market? Three reasons: First is that I wanted to! Second, it's January and real estate is generally quiet this time of year before the Spring Market really gets going. I had some spare time! And third, and this is probably the most important: Context is important. There's lots of talk of a shift in the market. Much of that talk is based in reality, and if you read my 2022 year-end update, you'll know how differently last year ended compared to how it began. However, I also don't subscribe to the sky-is-falling notion that some folks do. It's a mixed bag of good and bad. But what I think I want to convey is that the current market, while unique in its own way, is actually more reflective of a "normal" real estate market than the crazy, hot one we've gotten used to these past couple years.
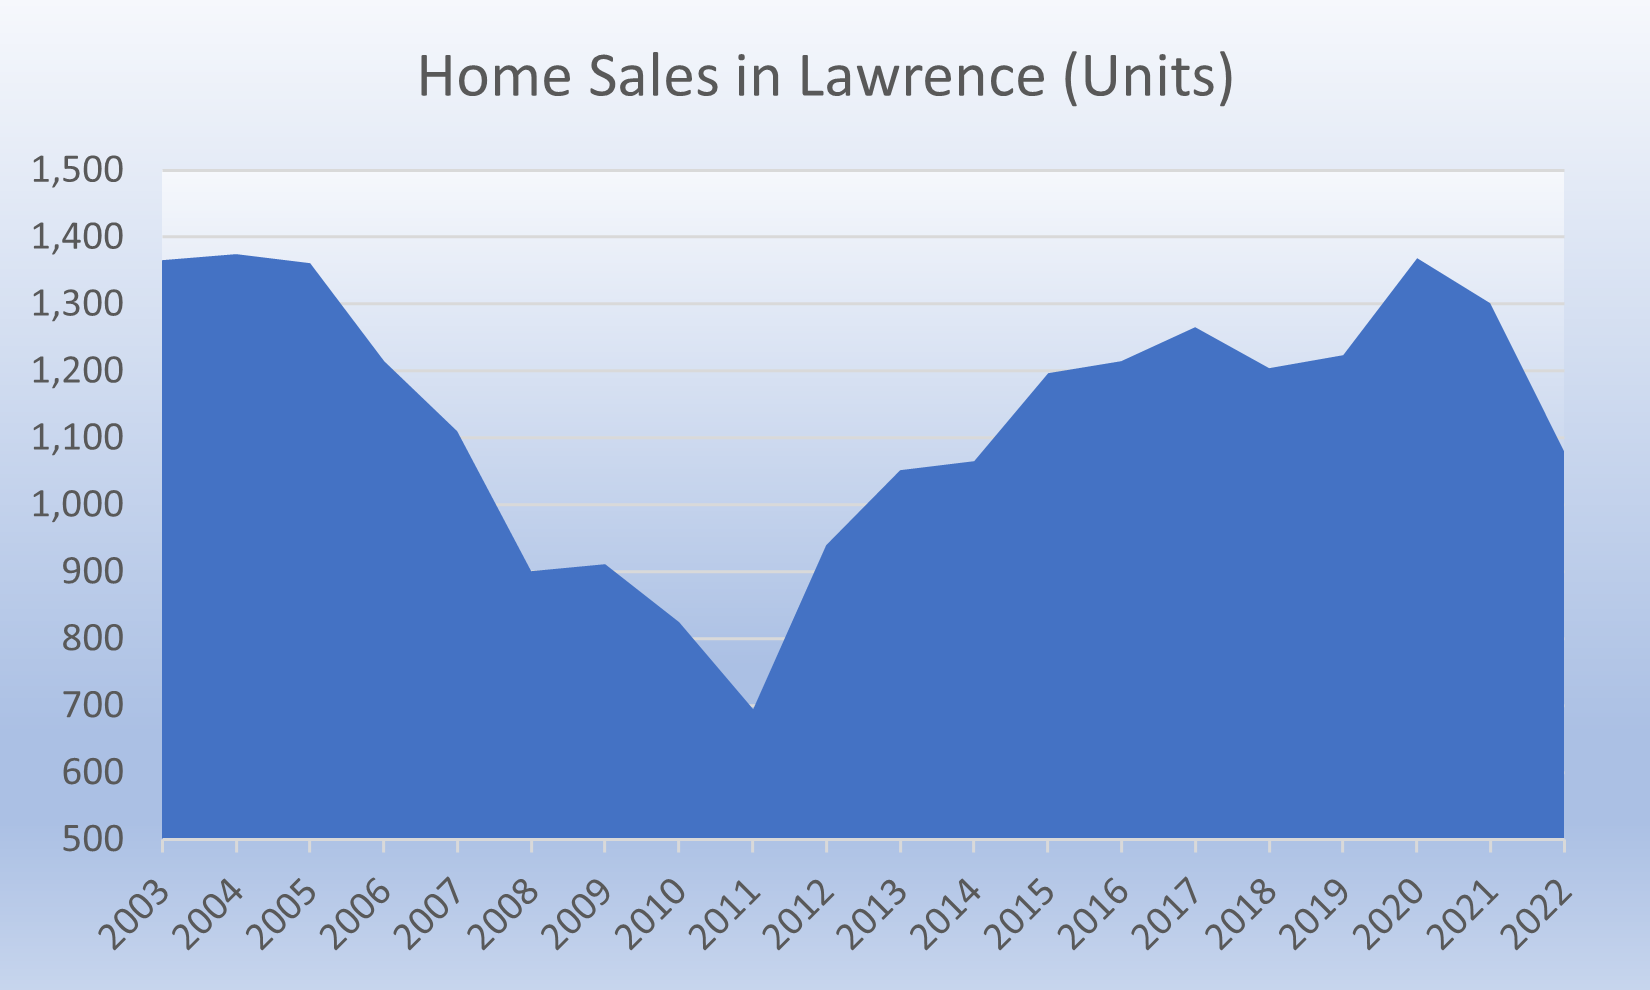
Let's start off with home sales. Over 20 years of data, the average number of homes sold per year in Lawrence is roughly 1,133. The record was set in 2004 with 1,375 sales and we've yet to match that high water mark again. What jumps out from the above graph is probably a surprise to no one: During the Great Recession (2007-2009) home sales rapidly declined from those early 2000's highs, and they continued to decline for a couple more years after that. Starting in 2012, home sales began a gradual ascent until a new peak of 1,369 sales in 2020. The second interesting point to note on the graph is the rather abrupt decline following that peak. 2022 saw the 6th lowest homes sales total in 20 years. This was primarily due to a major decline in sales in the second half of 2022, and particularly in Q4.
What's to make of this sudden decline after a decade of increasing sales? I think there's several elements to consider. Most people will immediately point to interest rate increases, but this is only part of the story. Yes, rates did make sharp increases last Fall and yes, those sudden increases acted like a shock to the market. A more gradual increase would not have impacted the market so drastically. What's more, is that the increases followed years of artificially low rates. Interest rates were long overdue for an increase. Years of low rates allowed many buyers to purchase homes on good terms, or for existing homeowners to refinance. Those home owners will not be sellers anytime soon.
This has helped fuel massive home value appreciation. Together with years of under-building, rising values coupled with rising rates were enough to put a touch of a freeze on buying activity. Throw some run-away inflation into the mix and it begins to look like a recipe for disaster. To the doomsayers I would counter that there is still a massive under-supply of homes available. Once buyers get used to a more "normal" rate environment and home value appreciation slows from its recent, unsustainable rates then buyer activity is likely to resume this Spring.
But within all of this discussion, I was to emphasize the upmost caution: 2023 is going to be extraordinarily difficult to predict. While I do expect a more normal market climate, and I don't expect any major price corrections, I'll re-state a previous prediction: We'll likely see fewer than 1,000 home sales in Lawrence this year. As seen in the above graph, it's been some time since that's happened, and when it did we were in a recession. Are we in the midst of one now? It seems very likely.
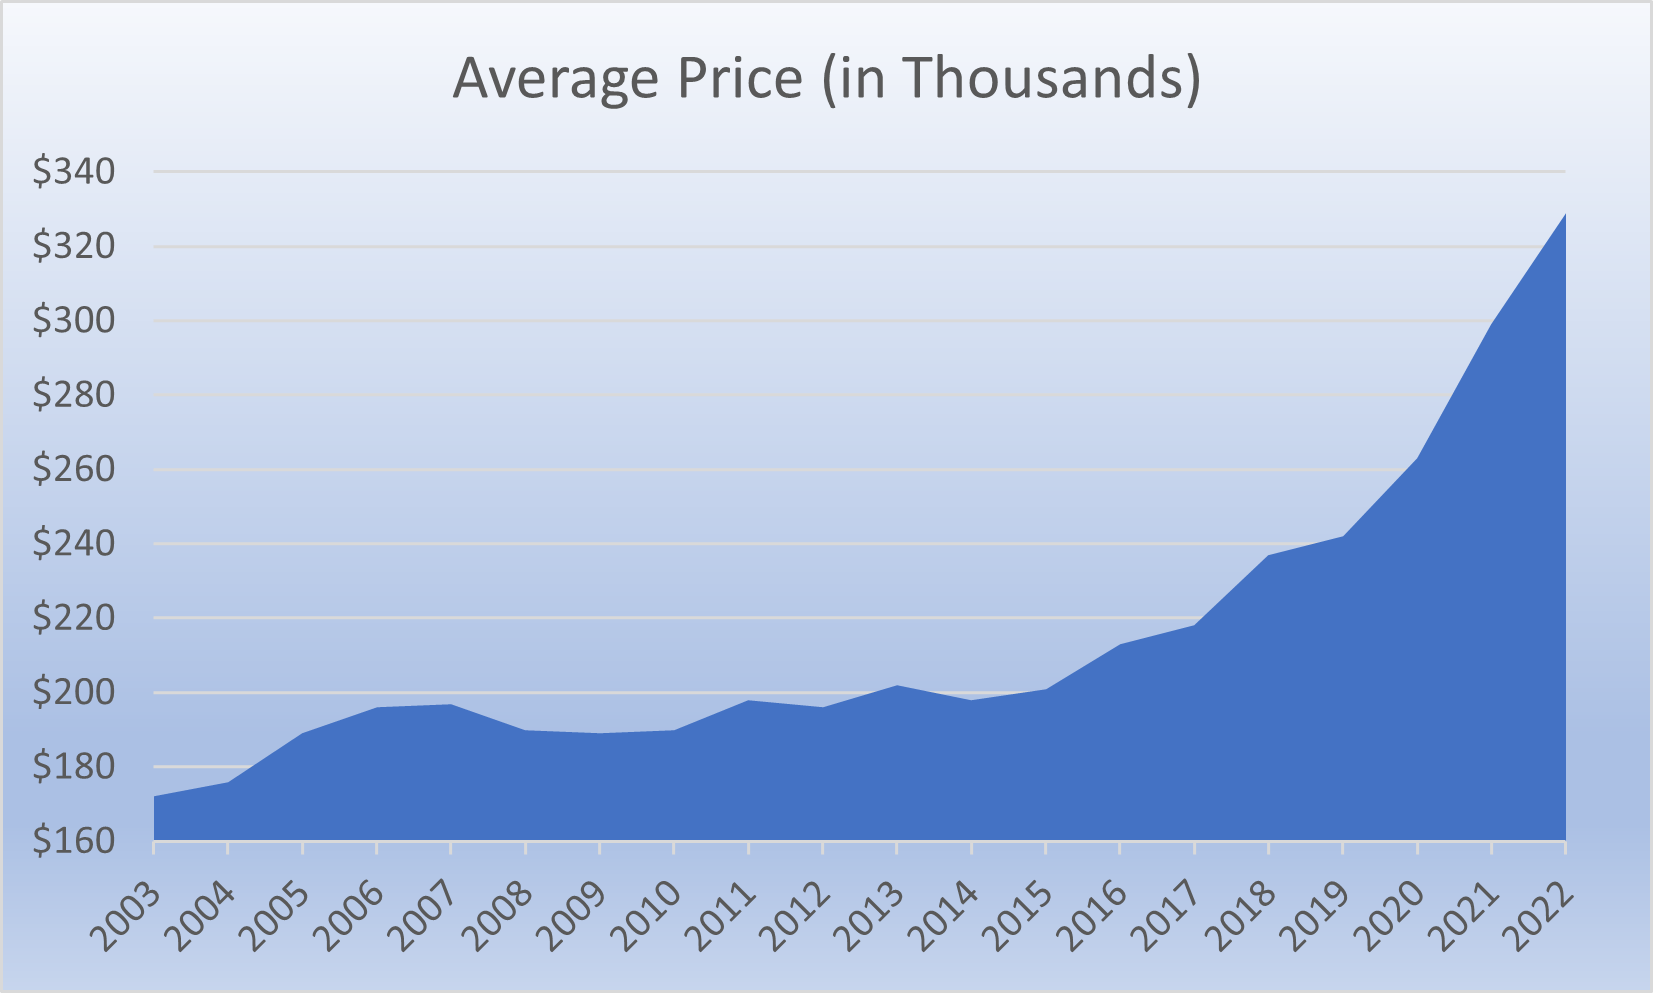
This all brings us nicely along to average home prices. To me, this is one helluva graph! Way back in 2003, the average home price was about $172,000. I think anyone old enough can recall the conversations about rising real estate values prior to the Great Recession. That trend comes to a halt in 2008 at the onset of the biggest market correction in most of our lifetimes. What's interesting though, is how modest those home value declines were. Of course, the recession did not hit Kansas as hard as other places. This downturn lasted just a few short years and in 2011 values began a slow ascent yet again. But look at that right side of that graph! Our current supply-side inventory issue really began to feed appreciation starting in about 2016 and 2017. That trend went into overdrive during the Pandemic in 2020 and holds through today, so far.
To help see the lack of available homes for sale over the past few years, it helps to also look at total listings.
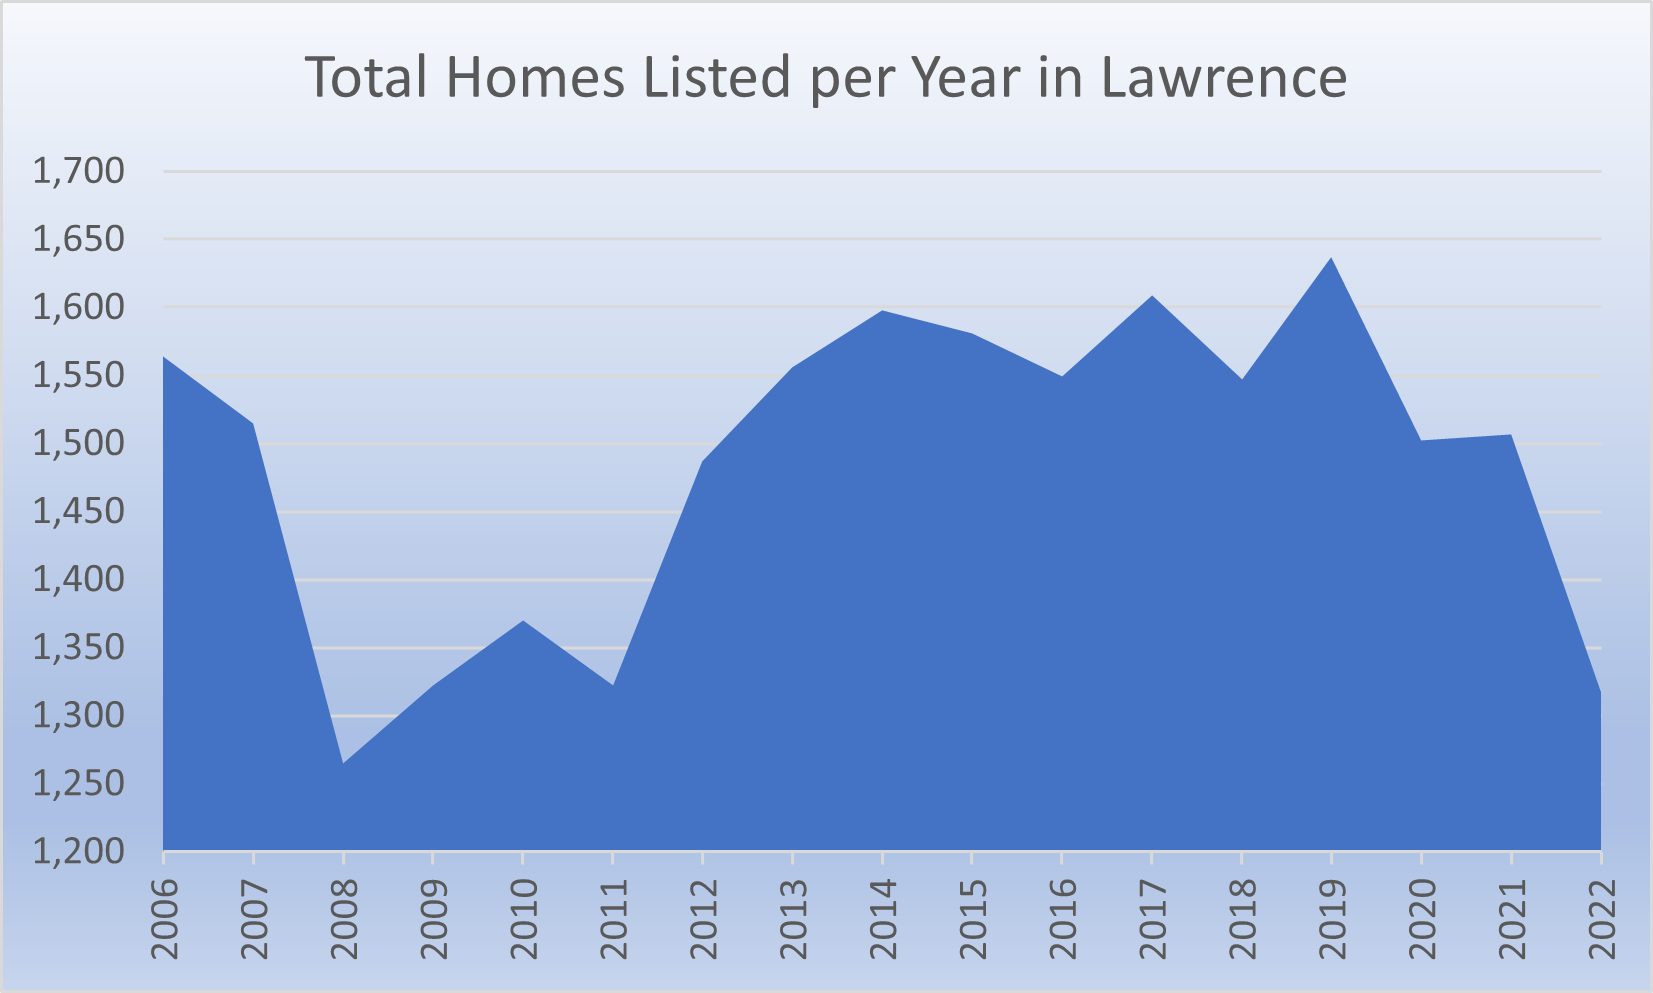
This graph looks much like the first one above. During the Great Recession, there was a massive decline in homes for sale. The market went so quiet, that many home owners decided to wait it out. While this lack of listing activity from 2007 to roughly 2011 was driven by the recession, we can't say the same about the similarly massive decline seen in 2022. So what's the deal? In contrast, today's market is being driven by overall lack of supply. Home sellers are simply choosing to stay put again. It's not that they fear a decline in value, how could they with the kind of appreciation in graph 2?
As I have previously stated, interest rates have been artificially low for years. Buyers bought a new home at a good rate, and existing owners refinanced. They're not going anywhere now! And further, while home sellers would be able to sell their current home at a huge profit, they have a problem: They have to turn around and buy in the same market. It's this hesitancy that's been a major factor in a lack of new listings over the past few years. To make the problem even worse, it's really hard to get a contingent offer accepted when there are multiple offers on a home. If they have to sell in order to buy, rather than compete, existing sellers might just be playing it safe and staying put for now.
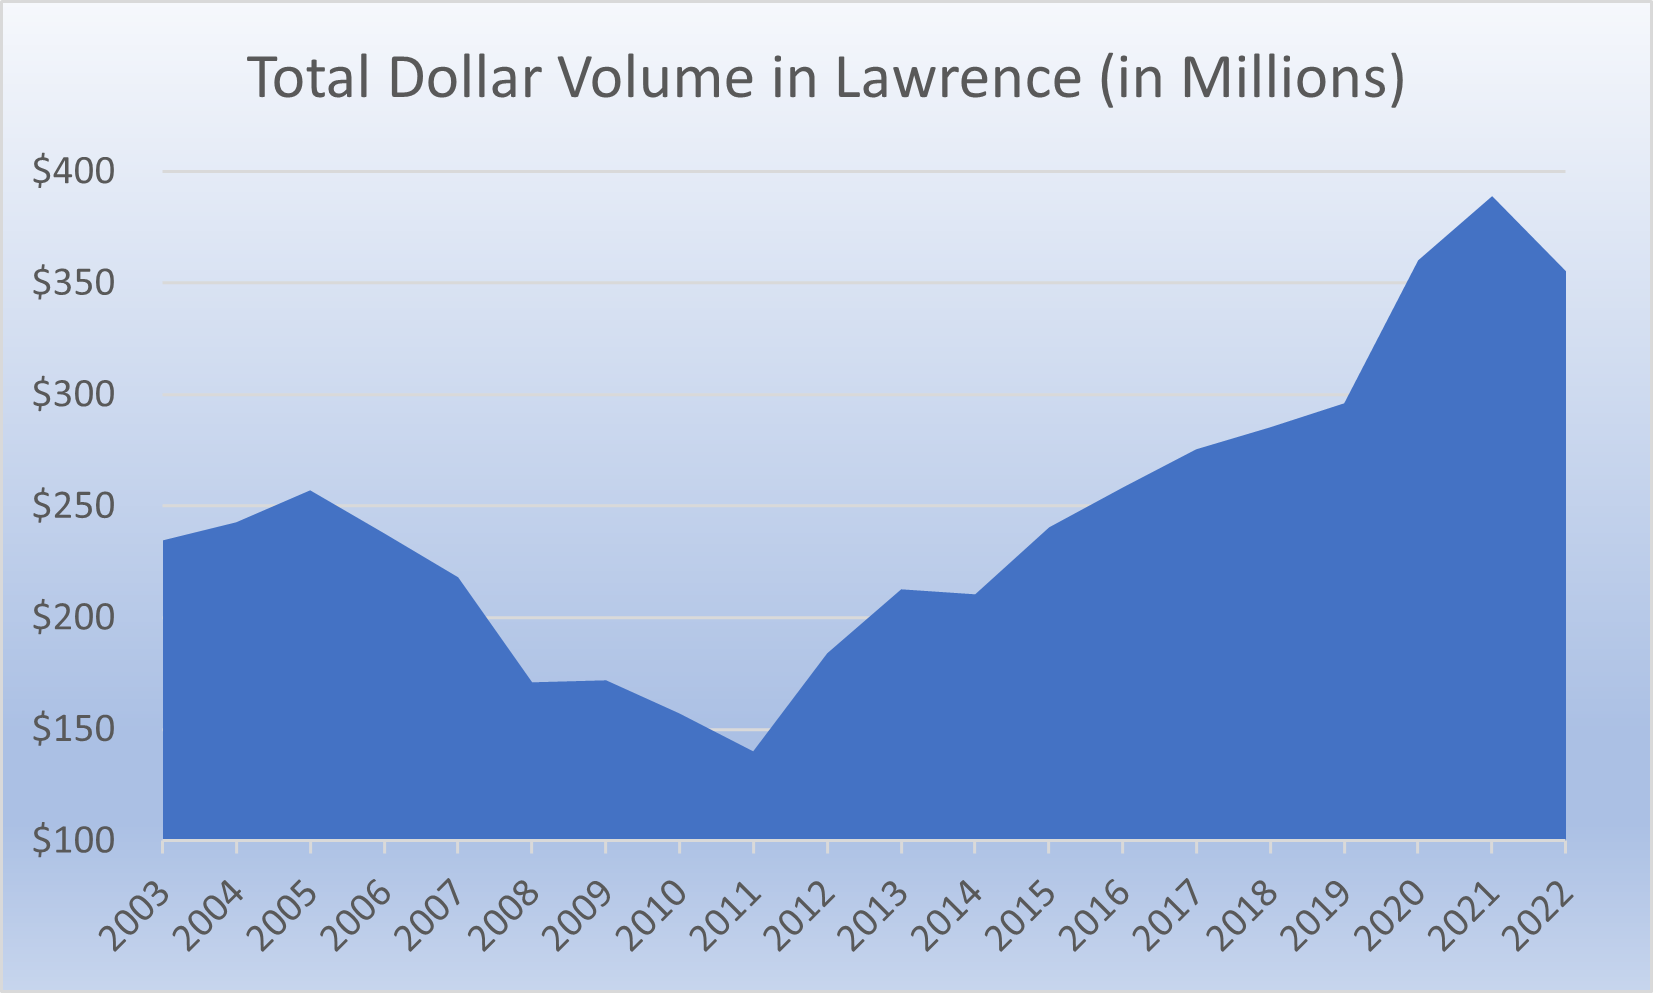
Another fun and interesting way to look at the history of the Lawrence housing market is to consider total dollar volume. It makes sense that massive recent home value appreciation is reflected clearly in this graph. The Great Recession is easily identifiable. And what's also interesting is that it took all the way until 2015/2016 to match pre-Recession totals. But here's where things get really interesting: 2022 saw the first decline in total dollar volume year-over year since 2011. This reflects the decline in overall sales seen in graph 1. This effect is largely due to the second half of 2022. Had things held at the same pace the market was at in January through July of 2022, these graphs would look totally different at the right end. Sales tanked so spectacularly, that even with 10-11% appreciation, total dollar volume collapsed in a reflection of so many fewer homes selling.
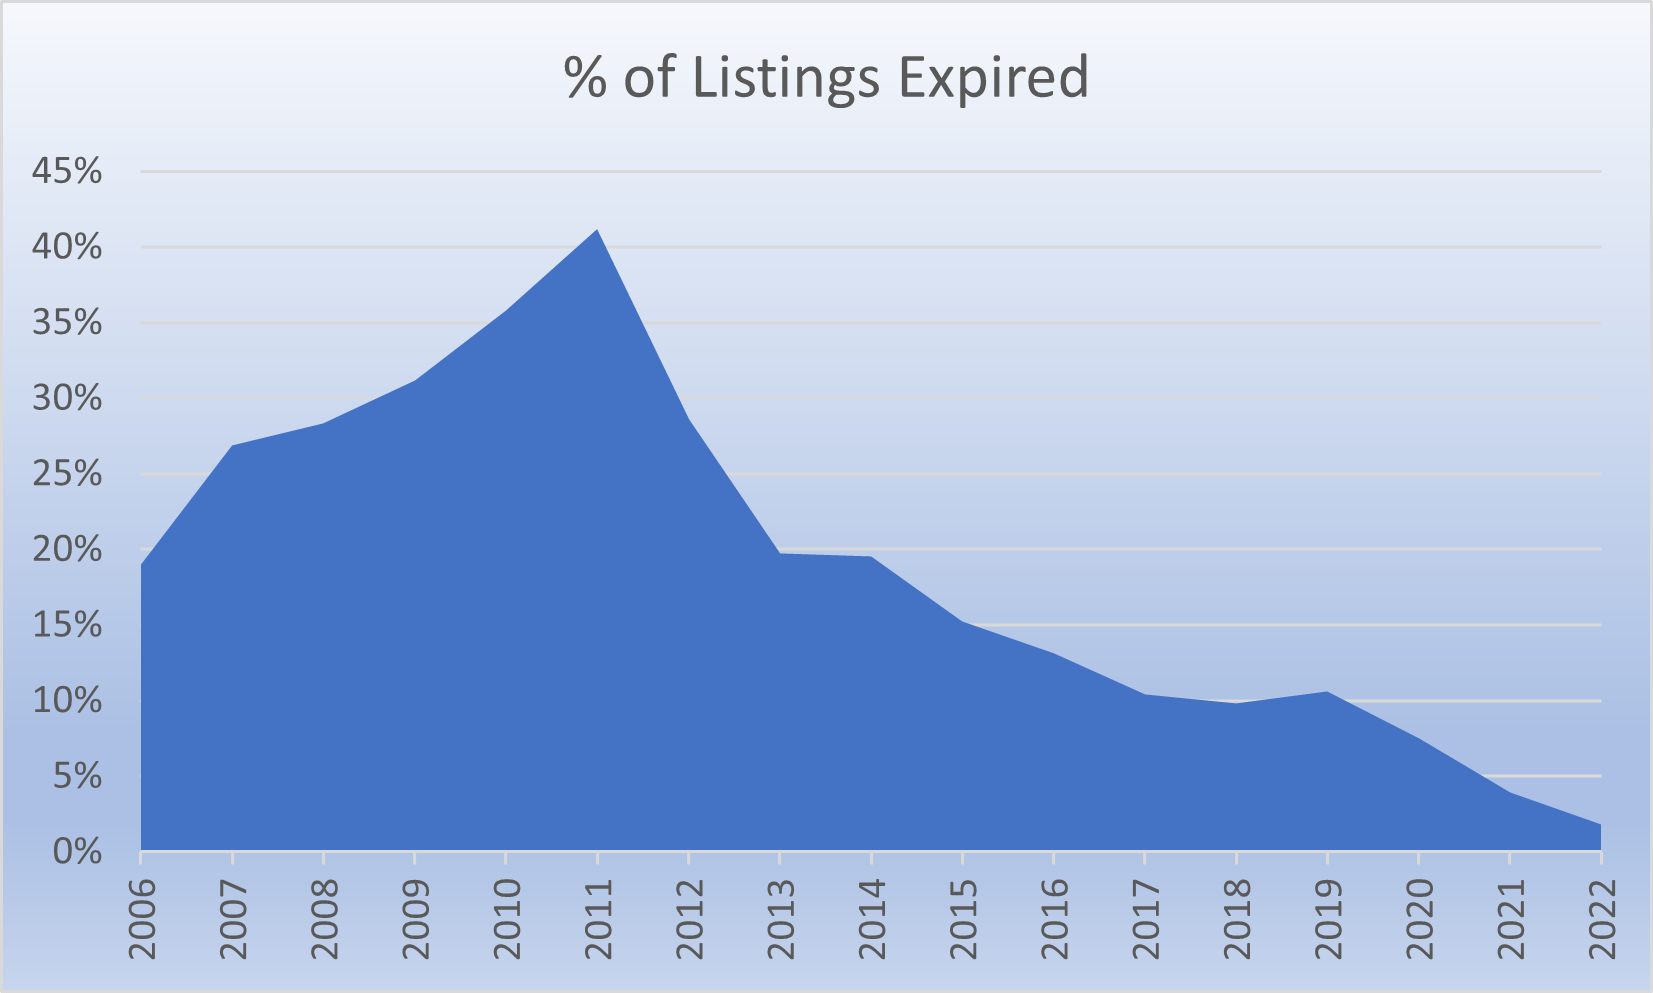
Moving on to another metric that I find interesting is the percentage of listings that expired in a year. This is a very helpful stat to understand what's going on in the local market. Even in a relatively strong pre-Recession market, the amount of listings that hit the market and didn't sell was pretty darn high. Roughly a quarter of all home listings expired. Then the Recession hit and the percentage jumped to an extremely high rate of almost 42%! As the market slowly pulled itself out of the downturn, this metric began to steadily fall. But look at the rate in just the past few years. Starting in 2019 it takes a huge plummet and ends up in 2022 at an astounding low of a 1.8% expired rate! This means the market is absorbing nearly every single home that lists for sale.
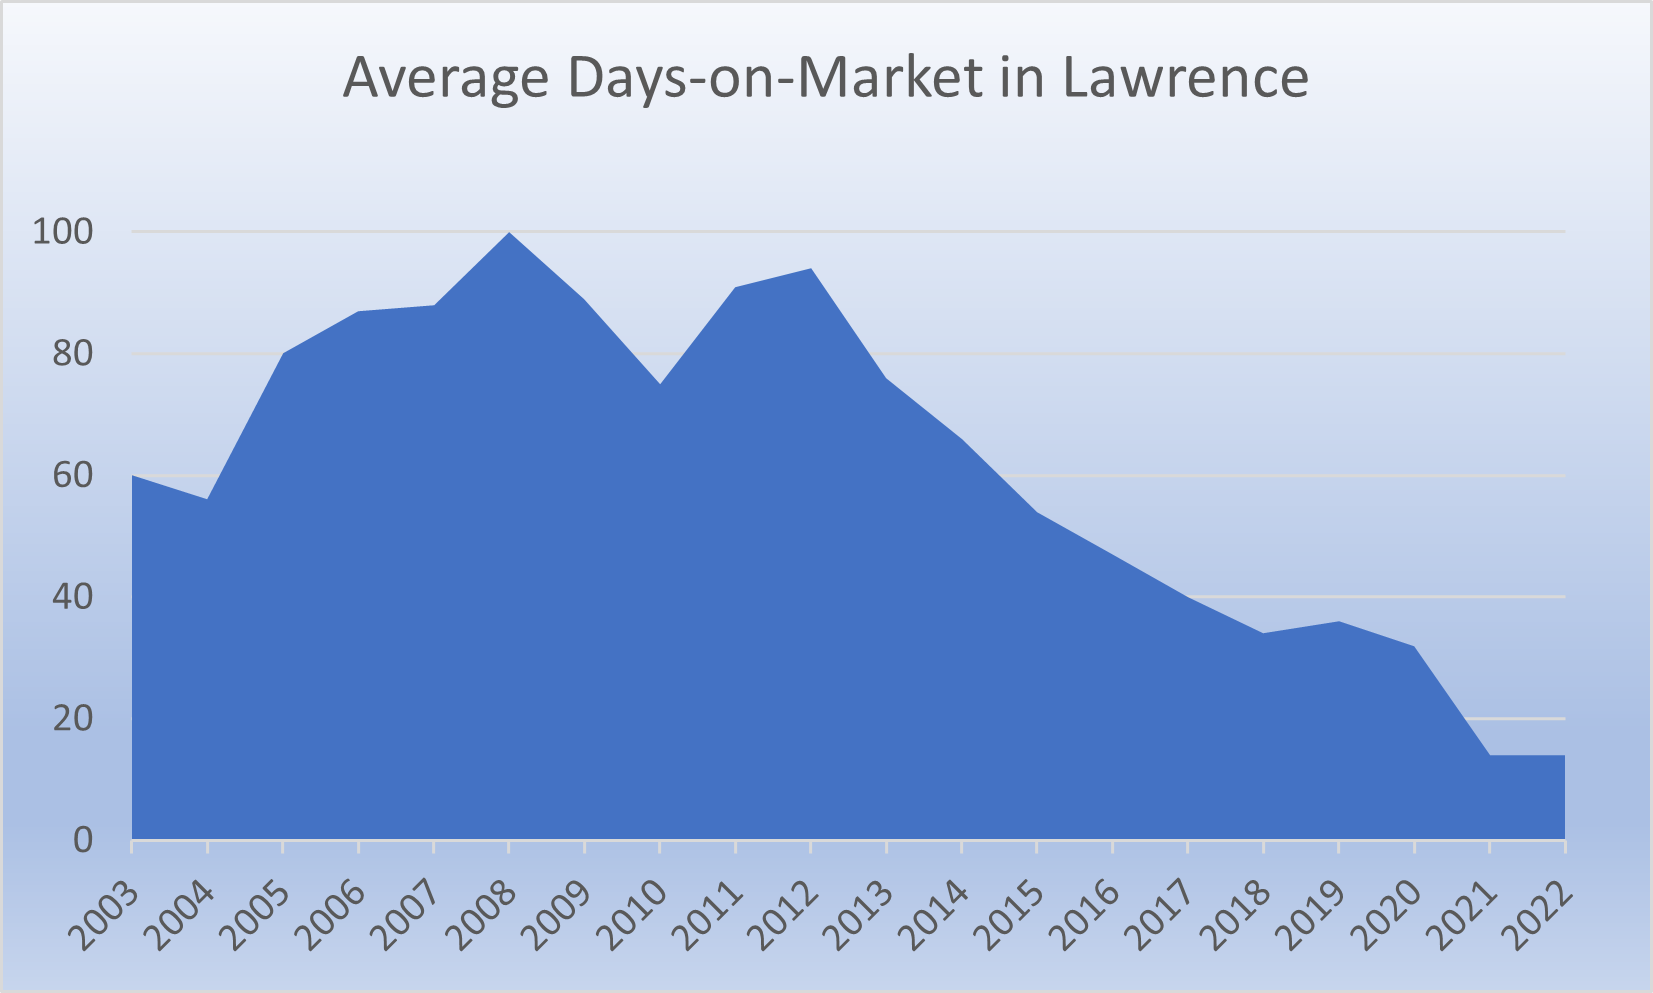
This graph is another helpful depiction of market activity: Days-on-Market. In a way, it's almost the same graph as the percentage of expired listings graph, or it can be looked at as the exact opposite of the home appreciation graph. And it makes perfect sense that those two are going to go hand-in-hand. Demand goes up, prices go up, days-on-market goes down. WAY DOWN! The experience of most home sellers these days is drastically different than it used to be. Coupled with the high expire rate, there was no guarantee that a house would sell and how long it would actually take. What used to literally take months now takes only days. What will be interesting to see is if these trends continue into 2023. So far, things are pretty slow and quiet. Will 2022 be the low point on the graph or will these new trends continue? Time will tell!
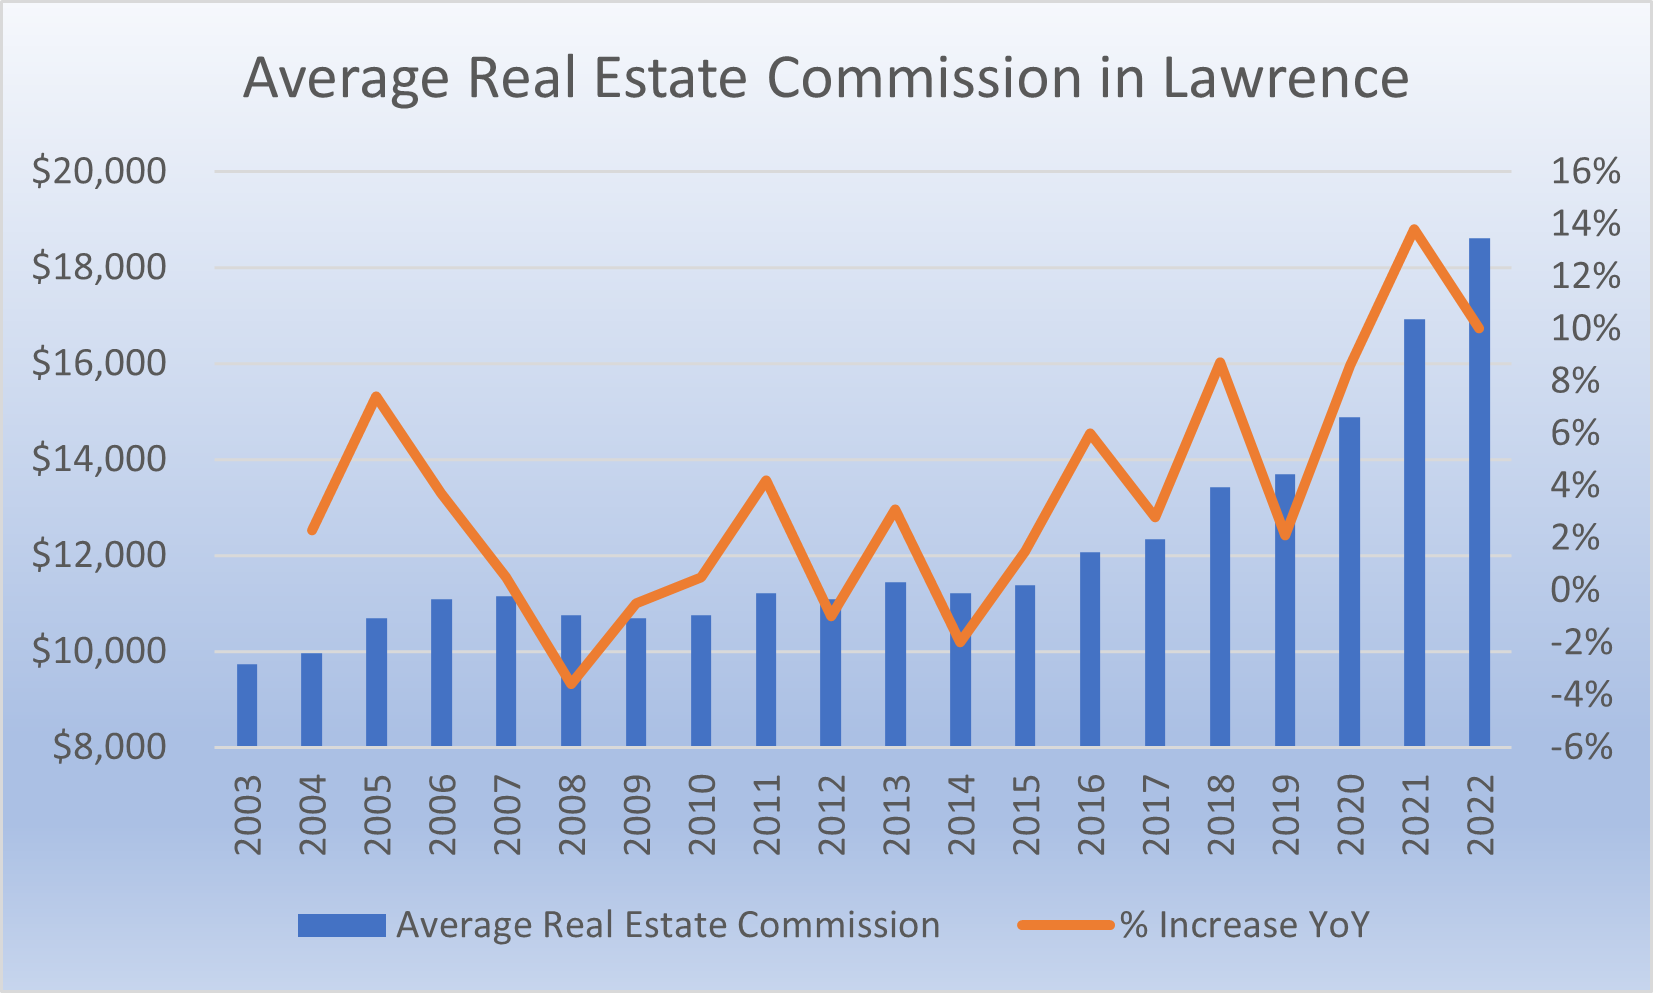
There's yet one more graph that I'd like to talk about and this is actually one of my favorite real estate topics: Commissions! While I think that this is an important thing to talk about, it can be contentious. It shouldn't be, so long as the public is educated about the truth of the matter. And that's one of the things I set out to do! Honesty and transparency should be at the core of any commission discussion. How much is it, and what do you get for it? Some backstory: in order to figure the average commission, I did a Google search on average commission in Kansas. I came to a site called listwithclever.com which listed an average commission percentage of 5.66% I have no idea where they got this, or if it's accurate or not. But it sounds roughly correct to me. If anything, it's a tad low. In my experience, 6% commissions are more common in Lawrence, but as time goes on, competition and change are exerting a downward pressure on this figure. So, for our purposes here, we're gonna roll with it!
Obviously this graph is going to mirror the Average Price graph above. It should come as no surprise that average commissions declined during the Great Recession. As the market normalized, commissions began a steady increase. Starting in about 2018, they began a massive increase. In 2003, the average real estate commission was just under $10,000. Today it's risen to an astounding figure exceeding $18,000! That means that in just 20 years, the average real estate commission has nearly doubled. Some, myself included, believe that technology and information have made the job easier, not harder. I'm not saying it's an easy job, as an experienced broker I can tell you that it most certainly is not. Not for any successful agent, anyway. But there's no denying that the role of the agent has changed.
However I do find this number a little hard to swallow. And I believe a majority of the buying and selling public would agree. To contrast this, at the average home sales price in Lawrence, the commission I charge with R+K Real Estate would be $14,370. That's a savings of over $4,000! And that's assuming that a seller is offering 3% for a buyer's agent. There's nothing written in stone that this is the case. In fact, and much of the public often seems unaware of this, ALL commissions are negotiable. Let's say a seller only offers 2% for a buyer agent (and I will remind everyone that 2% is more than 0%). In that case, a home seller would save over $8,000 with us! And keep in mind again, I'm comparing our commission figures with a 5.66% listing fee. Imagine the savings when compared against a "traditional" 6% listing! To illustrate, here's one last graph:
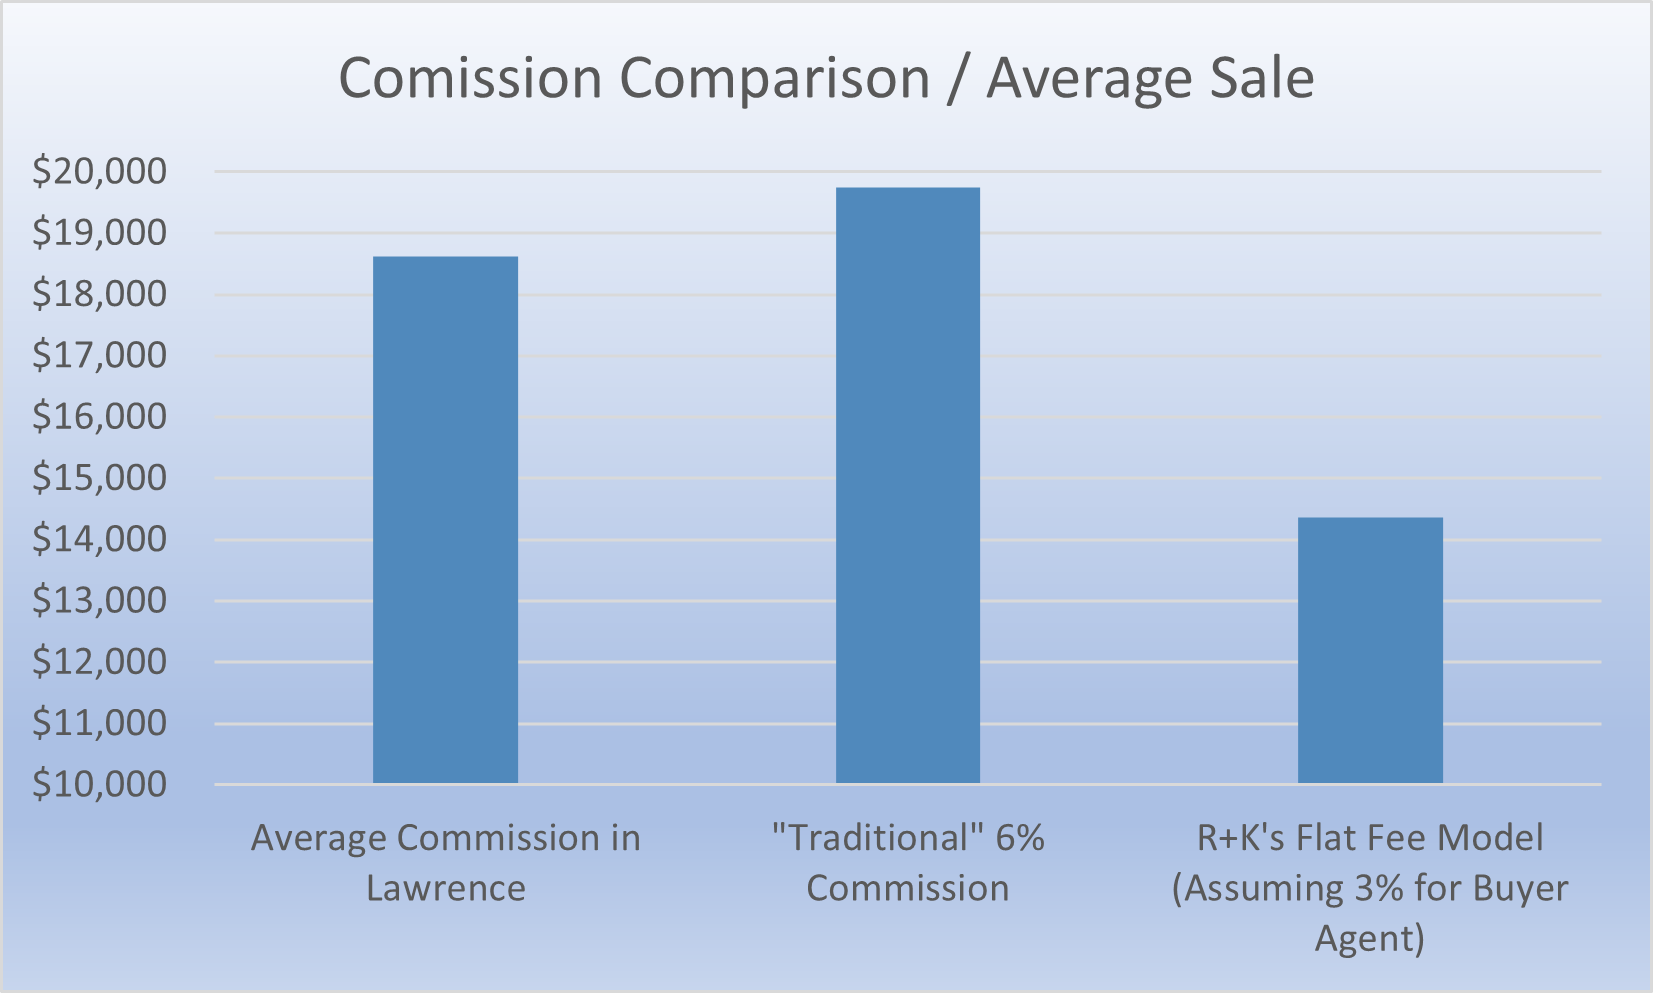
And I can't point all this out without emphasizing that it's for the SAME THING! R+K Real Estate is NOT a discount broker. We are a full-service company. We bring a high level of service and we have a ton of experience. We are among the highest producing agents in Lawrence. So why are our fees so different than everyone else? Simple: we're an independent broker and we don't have to share with anyone else. So, we share with our clients instead! We leverage technology and change in the industry to the financial benefit of ours clients. Last year alone we saved our clients $150,000 in commission costs! Why do we do this? Because we believe our model is an honest and transparent one to operate out of. And quite simply, because we love our clients and we feel it's the right thing to do!
That concludes my deep dive into the history of the Lawrence market. If you made it this far, I hope you enjoyed reading it as much as I enjoyed making it! Stay tuned to our blog page, our social media, and our Youtube channel for our monthly market updates as we make our way through 2023. It's bound to be an interesting year, no matter what happens!
-Ryan Desch, Broker/Owner/REALTOR ®


